OpenStreetMap logo OpenStreetMap

rphyrin's Diary

Recent diary entries

Offosm : OSM that you can access while you’re offline

Posted by rphyrin on 2 February 2026 in English. Last updated on 6 February 2026.

Starting in 2026, I slightly adjusted my daily routine, particularly around my weeklyOSM-related activity. Instead of passively consuming updates, I began actively scanning for news by lurking in several regional OSM online groups. Occasionally, genuinely newsworthy discussions emerge there.

One such case appeared today in the OpenStreetMap Braga (Portugal) Telegram group.

In the aftermath of Storm Kristin, which recently hit Portugal, multiple OSM-driven humanitarian initiatives surfaced. These efforts focused on mapping damage, identifying locations that require assistance, and highlighting places offering help.

At some point, the discussion shifted toward the need for a truly offline mapping application. Connectivity issues in affected areas appeared to render many OSM-based emergency platforms ineffective, simply because they still depend on an active internet connection.

This resonated with my own experience. I have built several “half-offline” OSM-based applications before. They are only partially offline because they store coordinate data locally in the user’s browser, while the application code itself and the OSM map tiles still require network access.

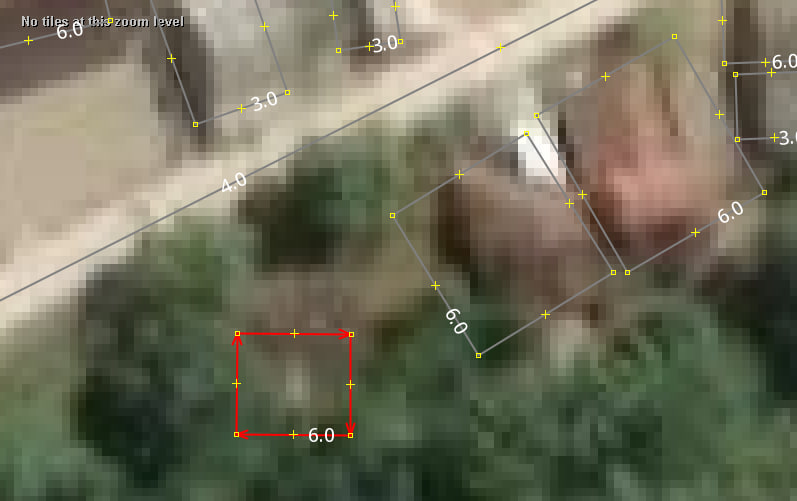
That led to a straightforward question: if we want a truly offline application, shouldn’t the map tiles themselves also be stored locally in the browser? Storing coordinate data is already trivial, but what about images? BLOBs? Is this feasible at scale?

While I was still thinking through these constraints, someone in the same Telegram group announced that an offline emergency platform had already been built. Naturally, I was curious and tested it by toggling my network connection on and off.

The result was clear: the application remained accessible offline.

See full entry

Mapping the Jakarta torrential rain of January 12, 2026

Posted by rphyrin on 12 January 2026 in English. Last updated on 14 January 2026.

This morning, when I woke up, I felt that something was different. The sky looked darker, the temperature felt colder, and the faint sound of drizzling rain outside carried a gloomy tone.

I immediately rushed to check the forum chat that morning, trying to scrape together information. What was going on out there?

07:17:55: “Heavy rain”
07:18:44: “Same here in Bogor”
07:19:39: “With a storm like this, how am I supposed to get to the office?”
07:39:11: “Anyone in North Jakarta who lives toward the east / near Bekasi. Is it storming there?”
07:40:20: “Yep. Storming. Starting to ease up a bit though.”
07:48:25: “Seems pretty widespread. Cikarang’s getting wind and rain too.”
07:50:04: “Still early morning but the rain is insanely heavy. What a Monday.”
07:55:41: “With rain this heavy, it’s best to just go back to sleep~”
08:00:26: “Heavy rainnn”
08:10:46: “The rain is so damn heavy.”
08:14:28: “Waiting for it to stop, but it’s just getting heavier.”
08:16:52: “This storm. No way I’m working. Just want to WFH.”

Heavy rain? A storm? How bad could it be? Here, the rain was only a light drizzle, but the darkness of the sky and the chill in the air felt very different. This wasn’t ordinary rain.

I kept reading the forum.

08:15:11: “Same in Central Jakarta, storm-level rain. Can’t work at all.”
08:29:58: “Force majeure, man. I ain’t leaving for work like this.”
08:37:55: “With rain this bad, offices should really normalize letting employees WFH, at least for sectors that don’t need physical presence."
08:40:00: “Stuck getting out of Tanah Abang. The rain’s way too heavy.”
08:45:47: “Early morning chaos in the airspace above CGK. Looks like no planes can land. Four domestic flights diverted to Lampung. Flight SQ950 had to do three go-arounds. This morning’s rain is insane.”

Huh?

So many planes couldn’t land at Soekarno-Hatta? How bad was the rain last night?

See full entry

A trip to the Ragunan Zoo

Posted by rphyrin on 8 January 2026 in English.

“From here, how do we get to Ragunan Zoo?”

Good question.

I paused. This wasn’t a matter of intuition; it was a routing problem.

I opened a navigation app, queried the destination, and switched the mode to public transport. The proposed solution was a multi-hop journey : take the blue commuter line to Manggarai, transfer to the red line toward Bogor, get off at Pasar Minggu, then continue with something called S15A.

S15A?

That identifier triggered a red flag. After a quick lookup, it turned out to be an angkot.

That immediately raised another question. Was there really no direct busway route to Ragunan? Not even a JakLingko alternative? Cost sensitivity was also a concern. There are plenty of public transportation modes in this city: MRT, LRT, Commuter Line, Transjakarta BRT, and Transjakarta non-BRT, but angkot and ride-hailing motorcycles are the two worst options, since they can end up being pricey due to the lack of government subsidization.

At that point, I decided to discard the initial navigation output entirely. Close the app. Start over with a more specialized tool.

I switched to the official Transjakarta application.

It refused to open and forced an update. Fine. Update first, then rerun the query.

Post-update, I defined the problem more explicitly. Assume the train leg was already completed. Starting point: Pasar Minggu Station. Destination: Ragunan. The goal was to find a replacement for the S15A angkot.

Search results came back clean. Instead of S15A, there was a JakLingko option: JAK47, Pasar Minggu–Ragunan. That was acceptable. Same endpoint, better integration.

Solution candidate number one locked in.


Then I expanded the scope. What if we removed the train entirely? What if the journey started directly from Bekasi using Transjakarta, via Vida to Cawang Sentral?

New query. New parameters. Starting point: Cawang Sentral. Destination: Ragunan.

See full entry

Last weekend I traveled to the west coast of Java, specifically Anyer in Banten. The journey was done by train from Jakarta to Cilegon, followed by a local shared minivan taxi to Anyer.

Throughout the trip, I collected field observations using Sakumap. The result was a raw GeoJSON file containing coordinates and timestamps for each entry.

For observations I considered significant, I wrote a detailed report on the OSM Wiki. Less critical features such as restaurants, fuel stations, farms, and forest areas were added directly to OpenStreetMap by importing the Sakumap GeoJSON into iD Editor or JOSM, without additional documentation on the wiki, as the overhead did not seem justified.

See full entry

Today, i wear OpenStreetMap

Posted by rphyrin on 21 December 2025 in English.

Today, i wear a T-shirt printed with Medan’s road network, based on OpenStreetMap data.

Every time i glanced down at those tangled lines, a quiet curiosity crept in. I kept wondering who mapped this exact line segment I’m looking at right now, which contributor traced it, corrected it, or patiently aligned it to reality. It’s a strange and comforting thought, carrying a small piece of someone else’s mapping work on fabric, a reminder that this map is made of countless individual moments of care.

Infohazard : Epilogue

Posted by rphyrin on 21 September 2025 in English. Last updated on 22 September 2025.

This afternoon, while pondering and daydreaming about seriously quitting OSM for real, I ventured into the land of Wikimapia.

Then I stumbled upon a conversation between high-ranking admins over there.

“Why did you delete a number of TNB sub-stations from the map? Don’t you think those tags were useful, to some people at least? I think the user(s) who initially created those tags put a lot of effort in detailing the model nos., etc. for some of the sub-stations. Thanks.”

“The TNB sub stations is not a place. It just an OBJECT just like small bridges, security guard post, small jetty etc. Different with a PLACE such as Pulau Pinang Bridge or any big bridges, police station or a port such as Port Kelang. As you can see there are few users that like to tag a small roadside stall and a small public toilet. That also is in the list for deletion. You must know to differentiate what can be tag and what can’t.”

“I was under the impression that anything permanent of some importance (except personal houses) could be tagged. If that’s the case, people shouldn’t be tagging ATM machines, telco towers, transmission towers, etc. To be honest, I disagree with you on this point as TNB substations are permanent and important to some people as I mentioned before.”

“You may disagree with me but TNB sub stations is not an important objects for WM users. It just like tagging a bus stops and taxi stands if you know what I mean”

Well, maybe I should stay in OpenStreetMap.


Jokes aside, I’m quite surprised that Wikimapia is still active today. I still see several Wikimapia mappers still doing dedicated micromapping in their respective neighborhoods.

See full entry

Infohazard

Posted by rphyrin on 20 September 2025 in English.

While working on an OSM-related statistics project that I need to present in the next few months, I stumbled across some ‘conversations of the past,’ scattered in changeset comments and block reports.

Some of those conversations triggered a strong emotional response in me—so much that I had to pause for a quick breather. I think I’ve just been exposed to a serious infohazard.

Then I remembered “that page” on Wikimedia Meta-Wiki.

Wikistress is stress caused by activity on a wiki like Wikipedia such as conflict, vandals, trolls, edit wars, and incivility.

I’ve suffered this kind of stress several times on Wikipedia, and now—since OSM is by nature quite similar to Wikipedia—I’ve relapsed again.

By the way, on that page, there are several tips for dealing with personal wikistress. I think we can adapt those tips to the OpenStreetMap context.

“Edit a less controversial page.”

Instead of big, difficult tasks such as place and highway classifications, adding things like toilets, cafés, restaurants, and pet shops might be less controversial (and more wholesome to do).

“Stop looking at your watchlist. It does contain pages that you are emotionally involved with. Of course, not having any pages in your watchlist is a good start :)”

Stay away from the OpenStreetMap Carto basemap (or any OSM-derived map tiles) for awhile?

“Take a long vacation. Treat yourself to relaxation, favorite TV shows (unless they cause you wikistress), spend time with friends, family, and pets, and maybe try something new.”

“If you are just reverting and deleting and not enjoying yourself then STOP. Someone else will have to deal with it. Do something else. “

“Remind yourself why it’s best to avoid fights and ignore trolls “

“Unsubscribe from the mailing lists and escape the pointless repetitive arguments, the endless recriminations and the general desire to create more heat than light.”

See full entry

Statistics.. Statistics.. Statistics..

Posted by rphyrin on 11 September 2025 in English.

I’ve been mulling over an idea for a while: what if we grab a complete snapshot of OpenStreetMap data for a given region, then run some statistics over it?

Things like which tags are most frequently used, who the top contributors are by edit count, and who has been active in that area the longest.

For the last one, “longest active” means the timespan between a contributor’s very first edit within that region and their most recent edit (also within that region). This distinction helps separate two very different contributor types: the one-hit wonders who show up during a mapping campaign, make a huge number of edits in a short burst, and then disappear forever; and the long-term caretakers, often locals, who quietly keep the map up to date whenever they notice changes in their surroundings.

To explore this idea, I had to build some tools.

Step one was downloading all OSM objects within a given administrative boundary (relation) : https://altilunium.github.io/osm-region-downloader/

See full entry

Sakumaps v2

Posted by rphyrin on 15 August 2025 in English. Last updated on 29 January 2026.

As a passenger in a moving car, I like to do OSM field mapping, constantly scanning the view outside and noting every detail I can spot. The catch is, I need to do it fast. Too fast to worry about proper tagging or structured data entry. What I really want is an app that shows my current location on a basemap, lets me tap anywhere on it to drop a point, and attach a rough plaintext note. Later, once I’m back home, I could export all those coordinates and notes as a GeoJSON file, import it into iD Editor or JOSM, and take the time to think about proper tags.

A few weeks ago, while traveling to Bandung, I tried doing “quick, live mapping on the road” with Vespucci. It turned out to be a bit of a nightmare. Each time I spotted something, I had to stop the GPS autofollow, download OSM data, add a node, pick a tagging preset, fill out the details, upload, and then repeat the whole cycle. By the time I was done with one object, I’d already missed several others. That constant stop-and-go completely killed the flow of observation.

What I wanted instead was a much simpler loop: keep the GPS autofollow running, spot something interesting, click on the map, type a quick note, and move on. No tagging, no data downloads, no breaking the momentum. Just rapid-fire, location-anchored note-taking while the car keeps moving.

At first, I tried building a dedicated Android app to do this. Unfortunately, my Gradle setup was corrupted, and fixing it meant re-downloading everything, which would have taken far too long. That’s when I remembered a small web app I had built three years ago for a similar purpose, although back then it didn’t have GPS tracking. So instead of starting from scratch, I decided to just add the GPS feature to that old app.

The result is now live at http://altilunium.github.io/sakumaps/v2.

See full entry

15 Years

Posted by rphyrin on 2 August 2025 in English.

“You’ve been involved with OpenStreetMap for at least 15 years,” the interviewers begin, marking the start of the session.

I gasp a little. Wow—15 years? Imagine all the… fights and drama?

So I get a little curious and start tracing this person’s digital footprints across the whole OSM universe. See if I can learn a thing or two.


“Upgraded road 11390 to secondary to make it stand out from all the other roads.. Because it has bus routes and stands out for transit traffic.”

“This reasoning sounds quite arbitrary to me. Also what degree of transit traffic is necessary so that the road has to ‘stand out’? General convention followed elsewhere outside of cities – and as currently documented – is to use this tag of this type and that tag for that type. The way this road stands out is now inconsistent to how other roads of these types stands out. I think it should be restored.”

“Hmm. That is a fun rule that’s easy to implement and validate. But what are you expecting to achieve with it, other than theoretical correctness – which in cartography is useless, as you might have experienced? I made it secondary, because of its heightened importance to transit traffic. So that routing engines prefer it when routing to there and not fall back on local roads. And even visual inspection would send people on it. So what would be the intention on changing it back?”

“The main benefit of mapping it to certain official classification is that this way we have a clear criteria. This official classification after all also generally indicates which roads are actually more important. If we tied tagging values to official traffic density data then probably it’d be considerably more difficult and likely the result wouldn’t be as intuitive for end users. I find that this way it’s rather difficult to decide on which highway value each road should get.”

The conversation abruptly stopped right there.

See full entry

LastUpdated v1.9_2025-06-08

Posted by rphyrin on 8 June 2025 in English. Last updated on 10 June 2025.

Recently, I needed to open my OpenStreetMap profile—just to right-click and save my own profile picture for use on another platform.

Thanks to the newly redesigned OSM profile layout, I was greeted by a few new statistics—one of which showed how many comments my last diary post had received. While I was busy grabbing my avatar, I couldn’t help but notice that my recent diary post had garnered quite a bit of discussion.

To my surprise, at least two commenters pointed out the same thing : they suggested it would be more intuitive if the value reflected actual months, rather than “something that roughly represents the progress of the year in base-10.”

That got me thinking—how hard would it be to convert that base-10 year-progress value into something closer to a conventional month (base-12)?


Step 1: Extract the Year

To compute the year from an OSM timestamp (Unix time), we start by offsetting it from a known reference point—specifically, the Unix timestamp for the start of the year 2000.

(osm_timestamp - 946692127) / 31556952
  • 946692127 is the Unix timestamp for Sat Jan 01 2000 02:02:07 GMT+0000. This value was arbitrarily chosen by me (high accuracy isn’t necessary; I just needed a reference point roughly around the year 2000).
  • 31556952 is the average number of seconds in a year (365.2425 days).

This gives us a floating-point number: the integer part is the year offset from 2000.

To extract the integer part (representing the year), we can substring the first 2 character:

substring(divided_by(osm_timestamp - 946692127, 31556952), 0, 2)

Oh wait!

While writing this post, I stumbled upon a small but interesting bug from the initial release.

Originally, the code extracted the first three characters of the computed year value. This worked fine for double-digit years like 2010 and beyond—10.5 would yield “10.”, which was sufficient for identifying the year and using the decimal as a makeshift separator between year and month.

See full entry

Recently, someone asked me to create a custom MapCSS style for JOSM that visually indicates how “fresh” OSM objects are—essentially, a way to distinguish recently updated or created objects from older ones at a glance.

Digging into the JOSM MapCSS implementation, especially the eval expression support, I realized this was very doable.

The Basic Idea

The approach is pretty straightforward. Each OSM object has a timestamp field (typically stored as a Unix timestamp). By comparing this timestamp to a reference timestamp (say, representing the current year—2025 in this case), we can calculate how “old” an object is.

So I hardcoded a reference timestamp for 2025, subtracted the OSM timestamp from it, and divided the result by the number of seconds in a year (ignoring leap years for simplicity). This gives us a rough “age” of the object in years.

See full entry

While editing the next edition of WeeklyOSM, I stumbled upon a fascinating case study that caught my full attention.

A certain team, responding to a certain request, set out to display a mobile device’s geolocation on a map—completely offline, without any network access.


Their initial approach? Crawling OpenStreetMap tile images one by one and storing them locally.

It didn’t take long before they hit a wall: the data size exploded, and keeping the tiles up-to-date turned into a maintenance nightmare. Sensibly, they scrapped that plan.


Next, they evaluated two open-source tools: tileserver-gl (JavaScript) and mbtileserver (Go).

In the end, they opted for mbtileserver, citing Go’s “security” over JavaScript. I still don’t fully grasp that reasoning (somehow, it involves a decision between verifying their own source code and verifying the entire JavaScript interpreter), and I even asked them in the comments section. But for now, let’s accept that as a given and move on.

After choosing mbtileserver, they needed MBTiles files to serve. Eventually, they discovered tilemaker, a tool that converts .osm.pbf files into .mbtiles.

They successfully tested it on a small area. Encouraged, they moved on to larger datasets. Then came the pain.

“…half an hour passes, and we experience a computer freeze as all the RAM runs out.”

Their machine couldn’t handle the memory load. So they requested a beefy VM—256 GB of RAM—and tried again. Still no luck.

That’s when they discovered tilemaker’s --store option, which dumps intermediate stages to disk instead of holding everything in RAM. That tweak made it work.


Creating an offline, custom OSM map has been my white whale for years. So I decided to replicate their setup on my own desktop.

I began with installing mbtileserver. That’s when I hit this cryptic error:

cc1.exe: sorry, unimplemented: 64-bit mode not compiled in

See full entry

Who's the Most Active Mapper in City X?

Posted by rphyrin on 20 May 2025 in English. Last updated on 23 May 2025.

So, I got invited to speak at a certain OSM community’s monthly online talk.

Nice, right?

Well, there’s just one problem: I have absolutely no idea what to talk about.

Sure, I could present one of my recent OSM-related programming projects, or share updates on what I’ve been mapping over the past few weeks. Maybe even talk about my personal hopes and dreams for the OpenStreetMap movement—or write a more reflective essay on the movement’s progress and future.

The deadline is still a ways off, so while I mull over the best topic, I figured I’d start with something simple. Something fresh. Something that literally popped into my head minutes before writing this post.

It all starts with a very basic question:

“Who is the most active mapper in city X?”


Why This Question Matters

If answered properly, this question could open the door to a whole series of follow-ups:

  • Are they local, organic contributors—not affiliated with a distant organized mapping group but actual residents who have lived in the city for a long time?
  • What does their OSM diary look like?
  • What have they been mapping lately?
  • Are they part of a local mapping group?
  • Have they initiated any projects in the past—or are they running one now?
  • Can we collaborate with them? Reach out?

Active mappers are often the “local ambassadors” of OSM. They can be our primary point of contact for a specific area—people who know the region inside out. They might even offer local tips, points of interest, or become a valuable reference for others mapping or traveling to the same area. Sometimes, these mappers even maintain detailed wiki pages for their city—outlining points of interest, transit routes, historical context, recent updates, or even personal anecdotes.


Meet Your Mappers

See full entry

Transjabodetabek B41

Posted by rphyrin on 18 May 2025 in English.

Although I read the newspaper (almost) every day, lately I’ve been getting news faster through my social circle. It usually starts as a rumor from an online friend, popping up on my timeline :

“There’s a new bus route coming to town!”

“Look at this photo I took— they’re testing the route!”

“I tried the trial run. Here’s a draft of the route I recorded myself.”

That’s what I’d been hearing for the past few weeks.

And then, finally, that rumors showed up in the daily newspaper I read.

See full entry

My First JOSM Validation

Posted by rphyrin on 17 May 2025 in English.

May 16, 2025 (22.46 PM) : “Before starting validation on Project 18915, would you mind assisting with validation on another project first? It would be helpful for practice on a few tasks/grids beforehand.”


Since this is my very first validation project, I thought it would be best to train myself beforehand.

To start, I needed to choose a project to validate. I preferred a recent and active one, so I decided on Project #20468, which was created in response to the recent earthquake in Myanmar. The objective of this mapping project is to identify clusters of residential areas to support better disaster mitigation efforts in the future. Individual buildings do not need to be mapped—only clusters of houses (more than five) using landuse=residential.


The first issue I encountered after clicking the “Validate” button was that JOSM needed to be open with “Remote Control” enabled.

So, I opened JOSM, navigated to Edit → Preferences → Remote Control, and enabled the option. Once that was done, the task loaded successfully from my browser into JOSM. That was a pleasant surprise—I hadn’t known JOSM had this feature.


Next issue: my favorite keyboard shortcuts from the iD editor didn’t work in JOSM. I figured the keys might be different, and wondered whether someone had already created a shortcut conversion table between iD and JOSM.

Eventually, I found the relevant information.

At the moment, I don’t need many shortcuts—just a few essentials. The wireframe toggle is particularly important since it helps me cross-check OSM data against the underlying satellite imagery. Additionally, I often want to inspect specific OSM objects; I’ve already prepared several Violentmonkey scripts (such as BetterOSM and OSMHelper) to satisfy my curiosity. For that, I need to open the original URL of an OSM object in the browser.

See full entry

OpenStreetMap Indonesia, in partnership with TomTom, organised a Community Mapping Party at GoWork Plaza Indonesia in Jakarta on Saturday, 26 April 2025.


Planning

January 23, 2025 – 17:05 WIB

“For those living in the Jabotabek area, how about we hold our first offline monthly talk next time and align it with the TomTom Mapping Party event?”

Initial discussions about hosting an offline gathering began among members in the Greater Jakarta area. A suggestion was made to align the monthly community meeting (usually held online, but in this proposal, it will be held offline for the first time) with an upcoming Mapping Party event organized by TomTom. The idea was presented in an open-ended way, inviting members to consider the possibility when time allowed.

January 30, 2025 – 08:34 WIB

“It might be better to hold it before Ramadan.”

The conversation picked up pace, with another participant suggesting that it would be preferable to hold the event before the fasting month (Ramadan) began. The comment hinted at the logistical advantages of scheduling it earlier.

February 3, 2025 – 11:01 WIB

“If it is held before Ramadan, preparation time would be very tight. It has been proposed to schedule it after Eid, possibly in mid or late April, and a response is still awaited.”

It was mentioned that holding the event before Ramadan might be too rushed given the short preparation time. As a result, a new proposal was introduced: to hold the Mapping Party after the Eid al-Fitr holiday, possibly in mid to late April. Final confirmation was still pending at that point.

March 23, 2025 – 14:28 WIB

“If we hold an offline mapping party and meetup at the end of April 2025 somewhere around Jabodetabek, would participants be able to attend?”

See full entry

Verschiedene Auszüge

Posted by rphyrin on 11 April 2025 in English. Last updated on 13 April 2025.

“Before 2011, if you asked most cartography professionals, they’d say OpenStreetMap was a toy. The turning point for me was a photo of a firefighter from a search and rescue team using a handheld GPS device—they used OSM maps to coordinate efforts after the Haiti earthquake.”

“During natural disasters like Haiti in 2011, nearby countries send search and rescue teams, and organizations like Doctors Without Borders and the Red Cross deploy. They requested a map to set up a field hospital. The Haitian government was basically like, “What? How?” So you go to Google Maps, right? Like anyone would. But there was nothing—Haiti had no commercial map coverage at the time. Even if there had been, it was likely destroyed. Then we showed up—just four OSM geeks—because nobody else cared about geographic data. With the help of 500 volunteers with iPhones, we mapped the entire street network of Port-au-Prince in a week. That map allowed NGOs to move through the city and save lives. It was a turning point—after that, the World Health Organization started listening to us.”

Flyers (April 3, 2025) “Expertos en cartografía: OpenStreetMap es la Wikipedia de los mapas” Medio Multimedia


See full entry

In 1973, Gunther W. Holtorf was assigned as the manager of Lufthansa in Indonesia.

From his first year working in Jakarta, many friends and visitors from abroad frequently asked him to act as their guide in the city. To assist his guests, despite having no formal background in cartography, he began sketching maps of Jakarta. His work proved useful and well-received, encouraging him to create a more detailed and comprehensive map of the city.

To achieve this, he initially approached the Jakarta City Planning Office. Instead of obtaining the topographic maps he sought as a base, he only found outdated maps of the city. This situation led the local civil servants to encourage him to produce a new map.

Gunther accepted the challenge. Every weekend, he explored Jakarta, navigating its narrow alleys and streets by foot, bicycle, and car. In addition to his weekend excursions, he also dedicated time each morning from 6:00 to 9:00 before heading to his office.

See full entry